 Home | Contact us
Upon successful installation of any one of the PCTRAN PWR Severe Accident Modules, clicking at “Run” will start the PWR at full power normal operation. The demo version will run till 600 seconds. It is not long enough to enter any core-melt or radiological release conditions. Instead you can evaluate the pre-stored cases by going to "Restart" and choose one in the initial condition list marked with "core heatup", "core collapsed" or "vessel penetration", etc.. Close the window and resume the run you will see the degraded NSSS and containment condition. Go to "View" and "Dose Mimic" to see the core and rad release dispaly. The run will continue indefinitely until it hits numerical failure due to extreme conditions. You can terminate it anytime by going to "File" and "Exit", or use the Windows close icon.
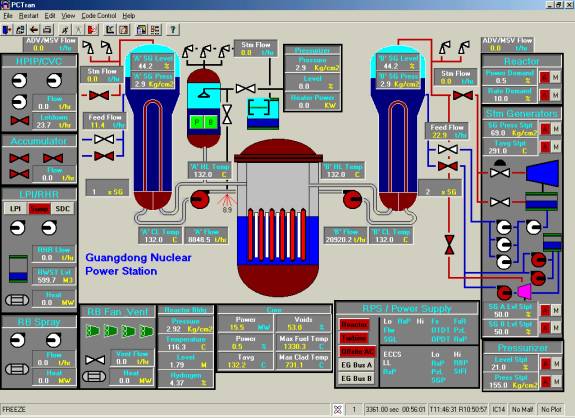
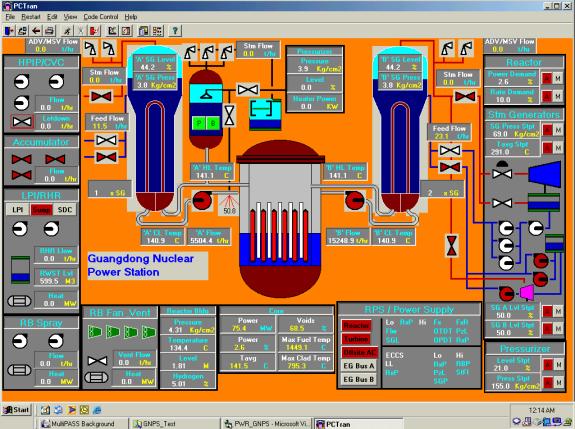
The following NSSS mimic all ECCS pumps are disabled (white in color) and core water level is below the top of active fuel.
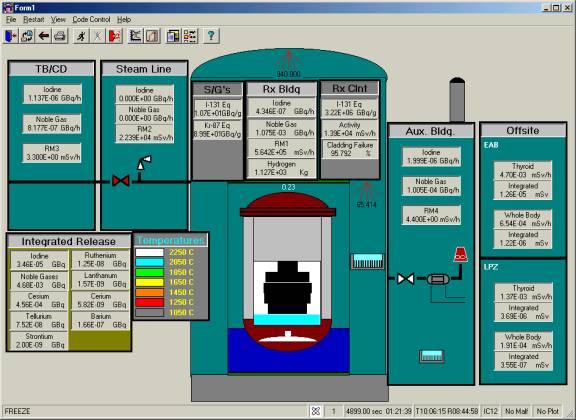
Maximize the window and click “View”, “Dose Mimic” will give you another view of the core and dose release configuration.
You may also activate any mitigation devices such as ECCS, PORV, containment spray, SG PORV, AFW, etc. and witness their impact and consequences.
For introduction of PCTRAN into applications of Severe Accident Management Guideline (SAMG) and PSA, we have completed extensive benchmark against MAAP for a generic Westinghouse 3-loop PWR plant. MAAP is an established code developed for EPRI by FAI. The scenarios cover LOCA, ATWS, LOFW, SGTR, LOP and loss of DC power and auxiliary feedwater (station blackout). By showing reasonable agreement between the two code’s predictions, PCTRAN is proved to be a proper tool for SAMG training, strategy development and emergency exercise.
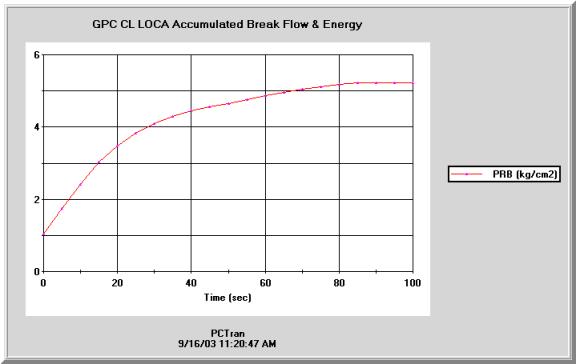
A double-ended cold leg break is simulated by 2000 cm2 break in the cold leg (malfunction #2). After all ECCS components start, only one train of charging (HPSI), LPI and containment spray are left running. The accumulated break flow and energy are shown below for comparison with Figures 4.1-1 and 4.1-2, results based on FSAR and MAAP.
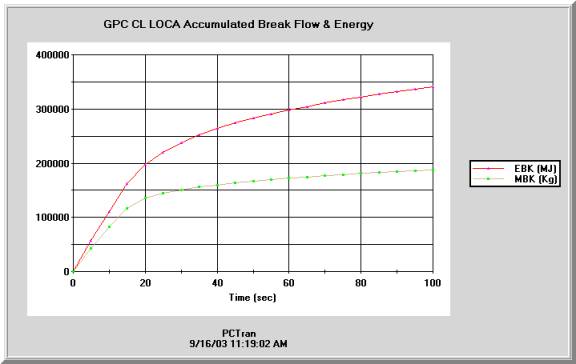
Figure 4.1-1: Cumulative Mass Flow out of the Double-Ended Hot Leg Break showing good agreement between MAAP model and the FSAR results
In the first 30 seconds, PCTRAN reproduced the accumulated break flow about 1.5E5 Kg and energy about 250,000 MJ.
Figure 4.1-2: Energy Release, Double-Ended Hot Leg Break, showing good agreement between the MAAP model and the FSAR results until core uncovery at 10.3 seconds
(the MAAP results are the lower curve)
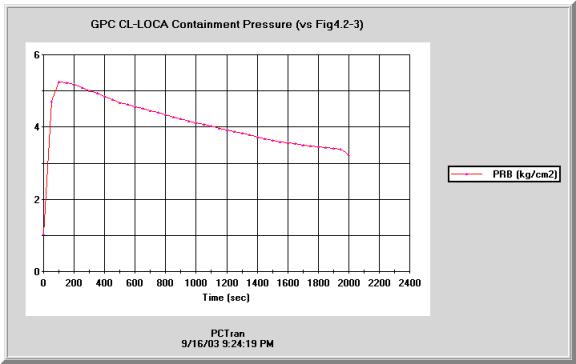
The containment pressure and temperature from PCTRAN are shown below
Containment pressure long-term
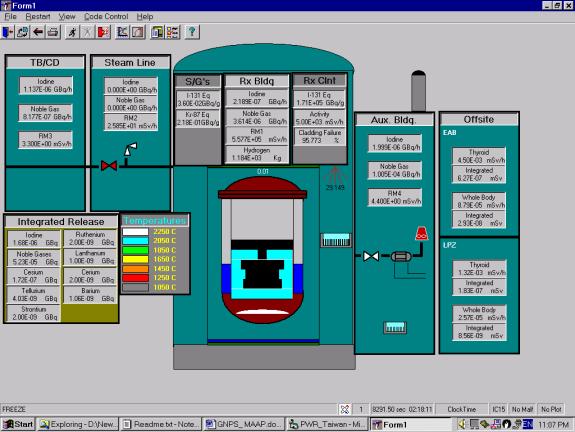
For the SAMG event, both trains of ECCS were assumed to run for maximum rate of depletion of the RWST. At about 1000 seconds after the double-ended break, recirculation from the sump was assumed to be lost. The core subsequently became uncovered, melt, collapsed and eventually debris penetrated the vessel. The degraded core mimic is shown below:
Following are the PCTRAN transient results:
The first figure is decay heat; PCTRAN used ANS5.1 1971, it is reasonably close to both MAAP and FSAR in Figure 4.2-4.
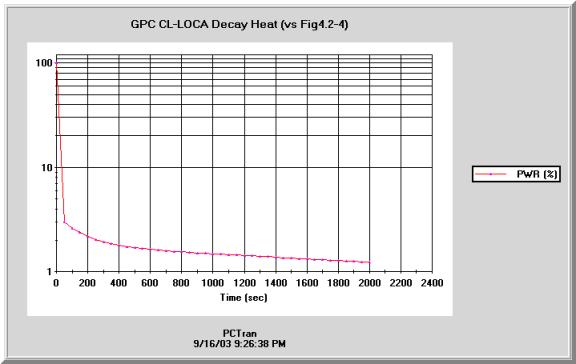
Figure 4.2-4: Decay Heat Comparison, Double Cold-Leg Break
Next is the containment atmosphere temperature. The initial peak at about 140°C is slightly lower than those from MAAP and FSAR in the 160 – 180 °C range in Figure 4.2-5. The initial peak containment pressure of 5 kg/cm2 abs is comparable to MAAP and FSAR values around 4.2 to 4.6 atmosphere. Note, the unit kg/cm2 is very close to bar or atmosphere.
Without sump recirculation, the core is soon uncovered and the clad and fuel temperatures start to heat up. At about 5,000 the core melts and later collapses to the vessel bottom. At about 10,000 seconds the vessel penetrates to drop the debris into the cavity. The containment pressure and temperature then rise steadily. We did not extend the run longer because later on the event is relatively monotonic. Note the containment hydrogen once reached 5% by volume, it would be set to burn because presence of ignition sources. Hydrogen burned a few times until all zirconium in the core was consumed in the metal-water interaction. When hydrogen is burning in the containment, the background color changes to red and orange for a few seconds with a “bang” sound generated by the computer. This is in agreement with the TMI-2 event and prediction by MAAP runs. There are pressure spikes recorded but the containment does not breach.
At about 9,800 seconds into the transient, the vessel breaks through and the corium debris falls into the cavity. Sudden evaporation of the water pressurizes the containment to another elevated level. These are vividly demonstrated by the graphic mimics and transient plots.
Hydrogen burn takes place (note the concentration exceeds 5% and the background color change)
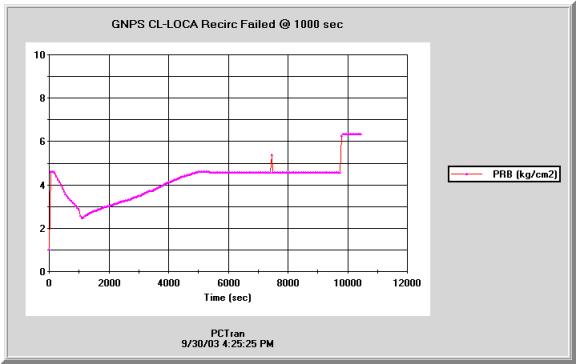
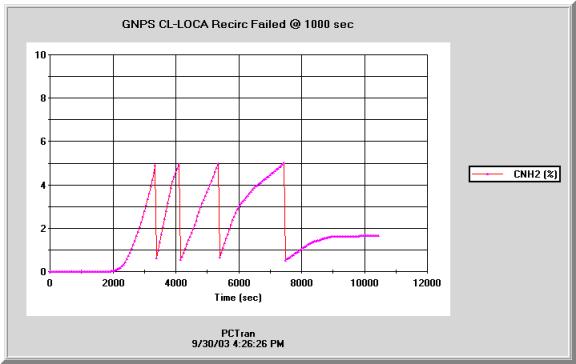
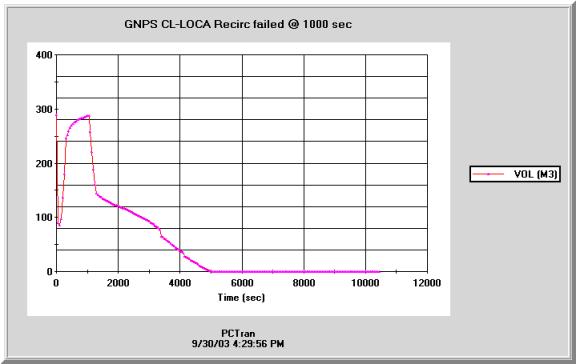
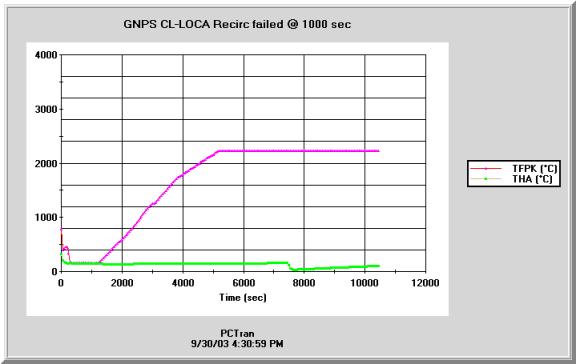
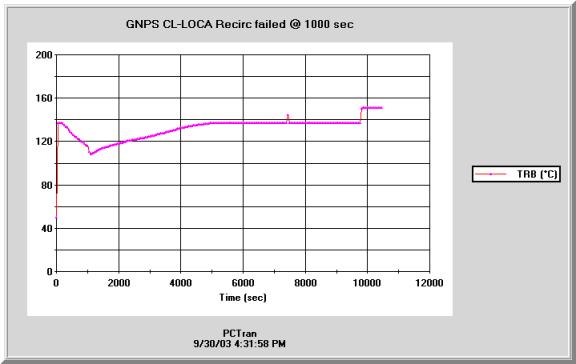
Figure 5.1-1: Water Levels for Case AHF . The first to go to zero is the PTR (called RWST in MAAP), followed by the Core. The cavity receives water after the vessel breaches, but it boils dry.
Figure 5.1-2: Containment Pressure, Case AHF . The three spikes at about 20,000 seconds represent hydrogen burn. The continuous pressure rise afterwards is due to core-concrete interaction off –gases.
Figure 5.1-3: Temperatures for Case AHF
PCTRAN has the kinetics model and malfunction mechanism to simulate an ATWS event. By initiating Malfunction 8 all RPS functions are disabled. He we try to benchmark the loss of feedwater event in the reference report. After loss of feedwater, the steam generator level decreases that should have trip the reactor by low SG level signal. Without a reactor trip the primary coolant temperature goes up. Negative moderator temperature reactivity coefficient feedback reduces the reactor power. The RCS pressure increases to lift the PORV. The following figures show the transient results.
Note that MAAP 4 does not have any kinetics model. Its power transient is a user’s input function. If is not appropriate for ATWS analysis.
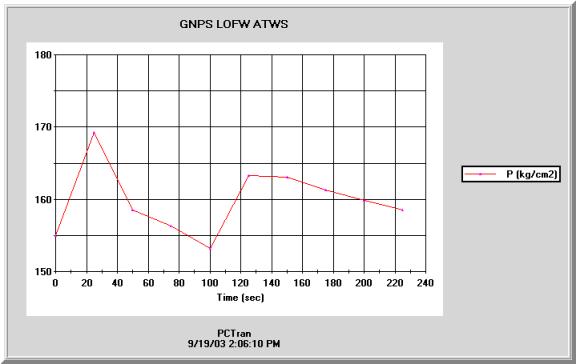
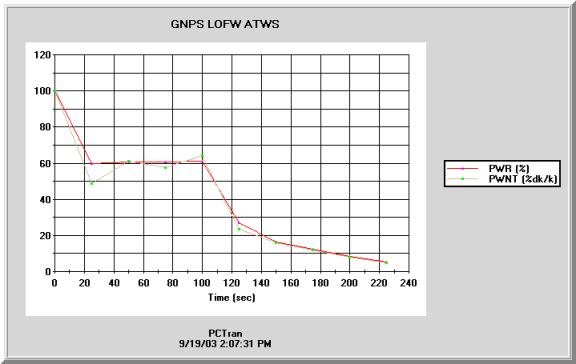
Figure 6.1-1: Primary System Pressure from ATWS case
We simulate this by closing all main and auxiliary feedwater isolation valves. We can also trip the main feedwater first stead; but that would trip the reactor and later on the auxiliary feedwater pumps would be started by automatic control system. Steam loss reduces the SG level to the low set point for reactor in 55 seconds. This is almost identical to the MAAP result. The SG secondary is then boiled dry. The primary RC coolant pressure increases to lift the PORV and expand the pressurizer level to the top. One PORV’s capacity cannot relieve over-pressurization, so the second and the safety valves open, too. Liquid discharge from the top of the pressurizer enters the drain tank and soon ruptures its disk. The containment pressure and temperature then rise. The high containment pressure set point starts the spray pumps that draw water from the RWST. The reactor maintains at high pressure when coolant is continuously lost through the pressurizer valves till core uncovery.
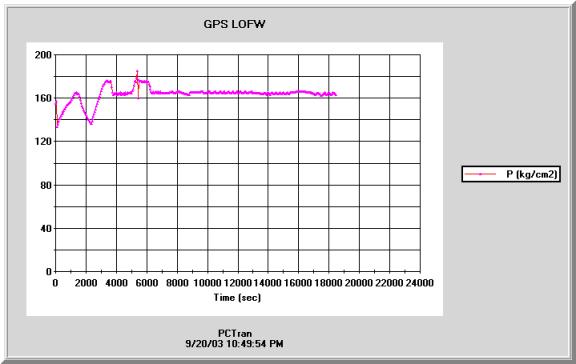
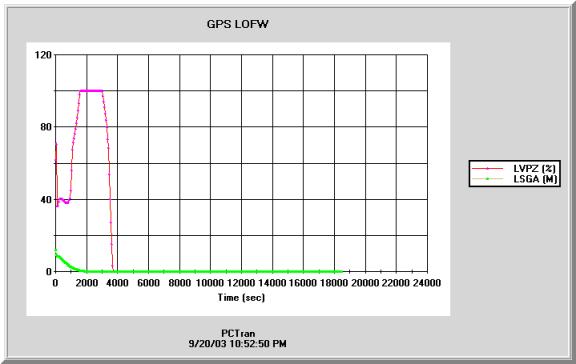
After core collapse and vessel break, the reactor is depressurized. If the LPSI is not available from the depleted RWST, debris would continue to drop into the reactor cavity and heat up the containment. These are all reproduced by PCTRAN.
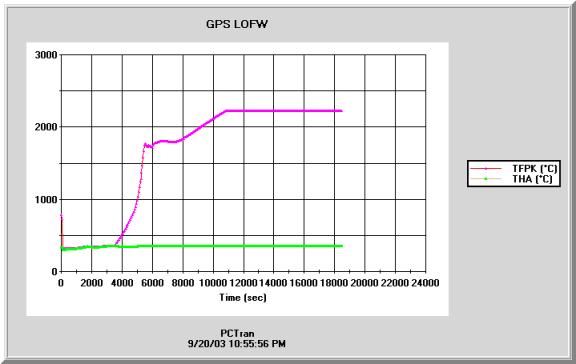
The following figures show the reactor coolant pressure stays up at the relief valve’s set point. The SG secondary is boiled dry in about 1,000 seconds. Fuel heat up starts at about 3,000 seconds and the primary coolant is boiled dry in about 5,200 seconds. All are consistent with the MAAP prediction.
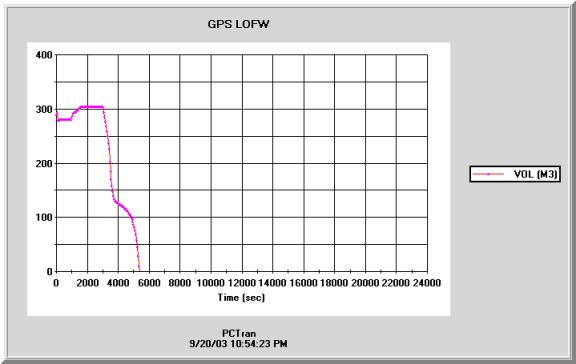
SGTR is the mostly likely event to occur in actual plant operation with possible dose release. It is however, not a serious threat to become a severe accident with catastrophic consequence. In the history of nuclear industry, numerous incidents have occurred already. To name a few, 1980 at the Ginna plant in New York, USA, 1985 at Mihama in Japan, and recently at Indian Point in New York (2001), all have double-ended single tube rupture events. So understanding the transient of a SGTR is very important for plant operation and accident mitigation.
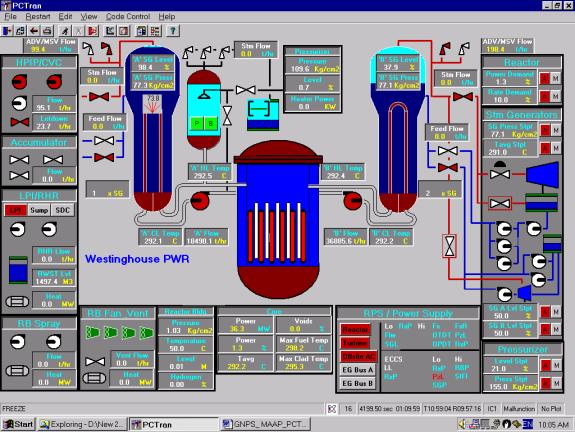
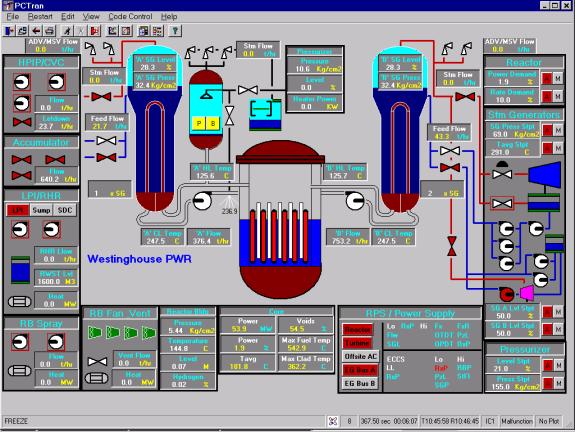
The ETS SGTR1 case was run with a double-ended SGTR in a single loop “A” side. The reactor is automatically tripped at about 350 seconds on low pressurizer level. Soon the pressurizer loses its level. High pressure injection makes up coolant loss in the primary side. The broken loop is filled up to the top of the steam generator. Steam to the turbine/condenser is blocked, so relief to the atmosphere is through the main steam safety valves in the broken side. Following is the plant configuration at about 4,000 seconds after tube rupture. Note the broken side SG is almost filled.
The pressures of RC and SG secondary sides are shown below. They are in close agreement with Figure 8.1-1.
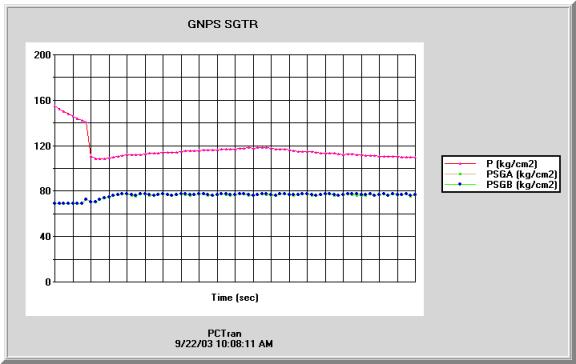
Figure 8.1-1: Pressure History from SGTR1.INP
We also plot the pressurizer and SG levels, HPSI, SGTR, and SG safety valve flows as below:
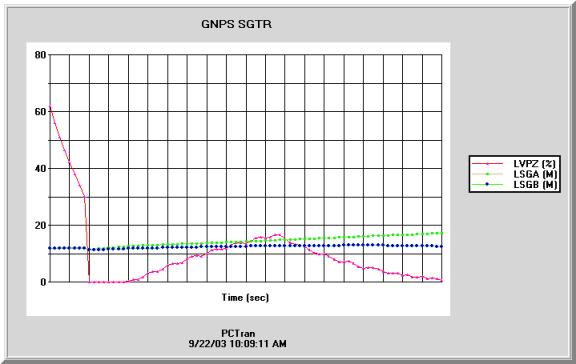
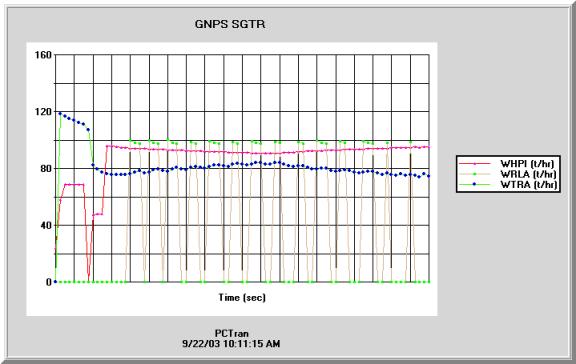
After the broken loop fill-up, the SG safety valve flow would turn into liquid. It takes considerable time for the HPSI to deplete the RWST (in the order of 30,000 seconds) and subsequent core melt. These are very much anticipated and predictable, so we did not continue the run.
The fifth category is loss of both AC and DC power supplemented with a reactor coolant pump seal LOCA. The break flow rate of 153,000 kg/hr corresponds to a 1,000 cm2 cold leg LOCA. In PCTRAN run we start with a LOOP and disable both emergency buses “A” and “B”. This will cause an immediate reactor scram, loss of all AC-powered RCP, HPSI, LPSI, AFW and containment spray pumps, pressurizer heater and steam dump to the condenser capability. Only the passive accumulators and turbine-driven AFW pumps are available for primary and secondary coolant makeup. In the following mimic representation, please note that the pressurizer heater indication in yellow means disabled. For pumps and valves, a red rectangle around white also means disabled.
Without AC-powered ECCS and a RCP seal LOCA, the containment quickly heats up to almost 10 atmospheres. This is higher than MAAP predicted 4.5 atm initially. PCTRAN calculated core melt in about 5,000 seconds and vessel penetration in about 6,000 seconds. They are also earlier than MAAP’s results. In our model we have assumed very little containment heat sink capacity. Some sensitivity study may be tested to see if this makes a difference.
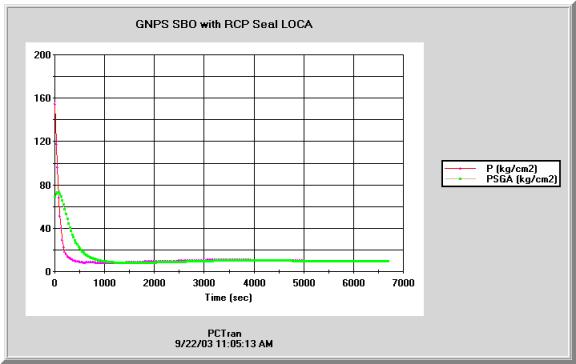
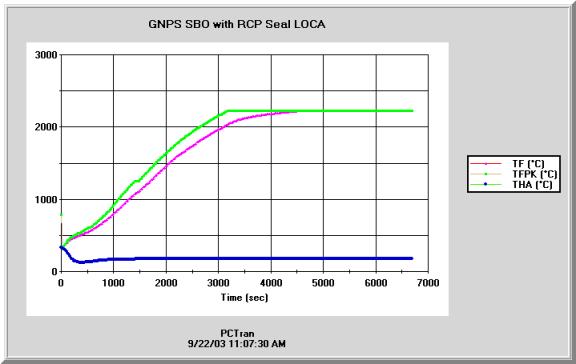
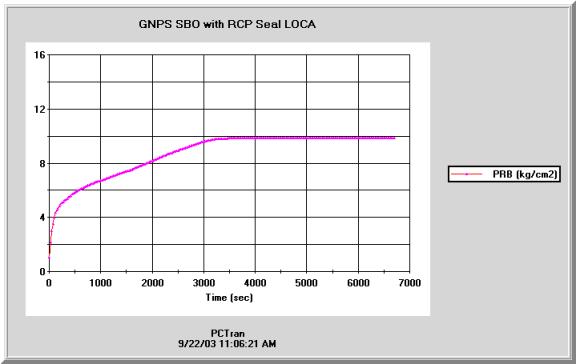
Figure 9.1-2: Containment Pressure for LOOP1